Juan Hernández
Fullstack Developer
Geneva, Switzerland
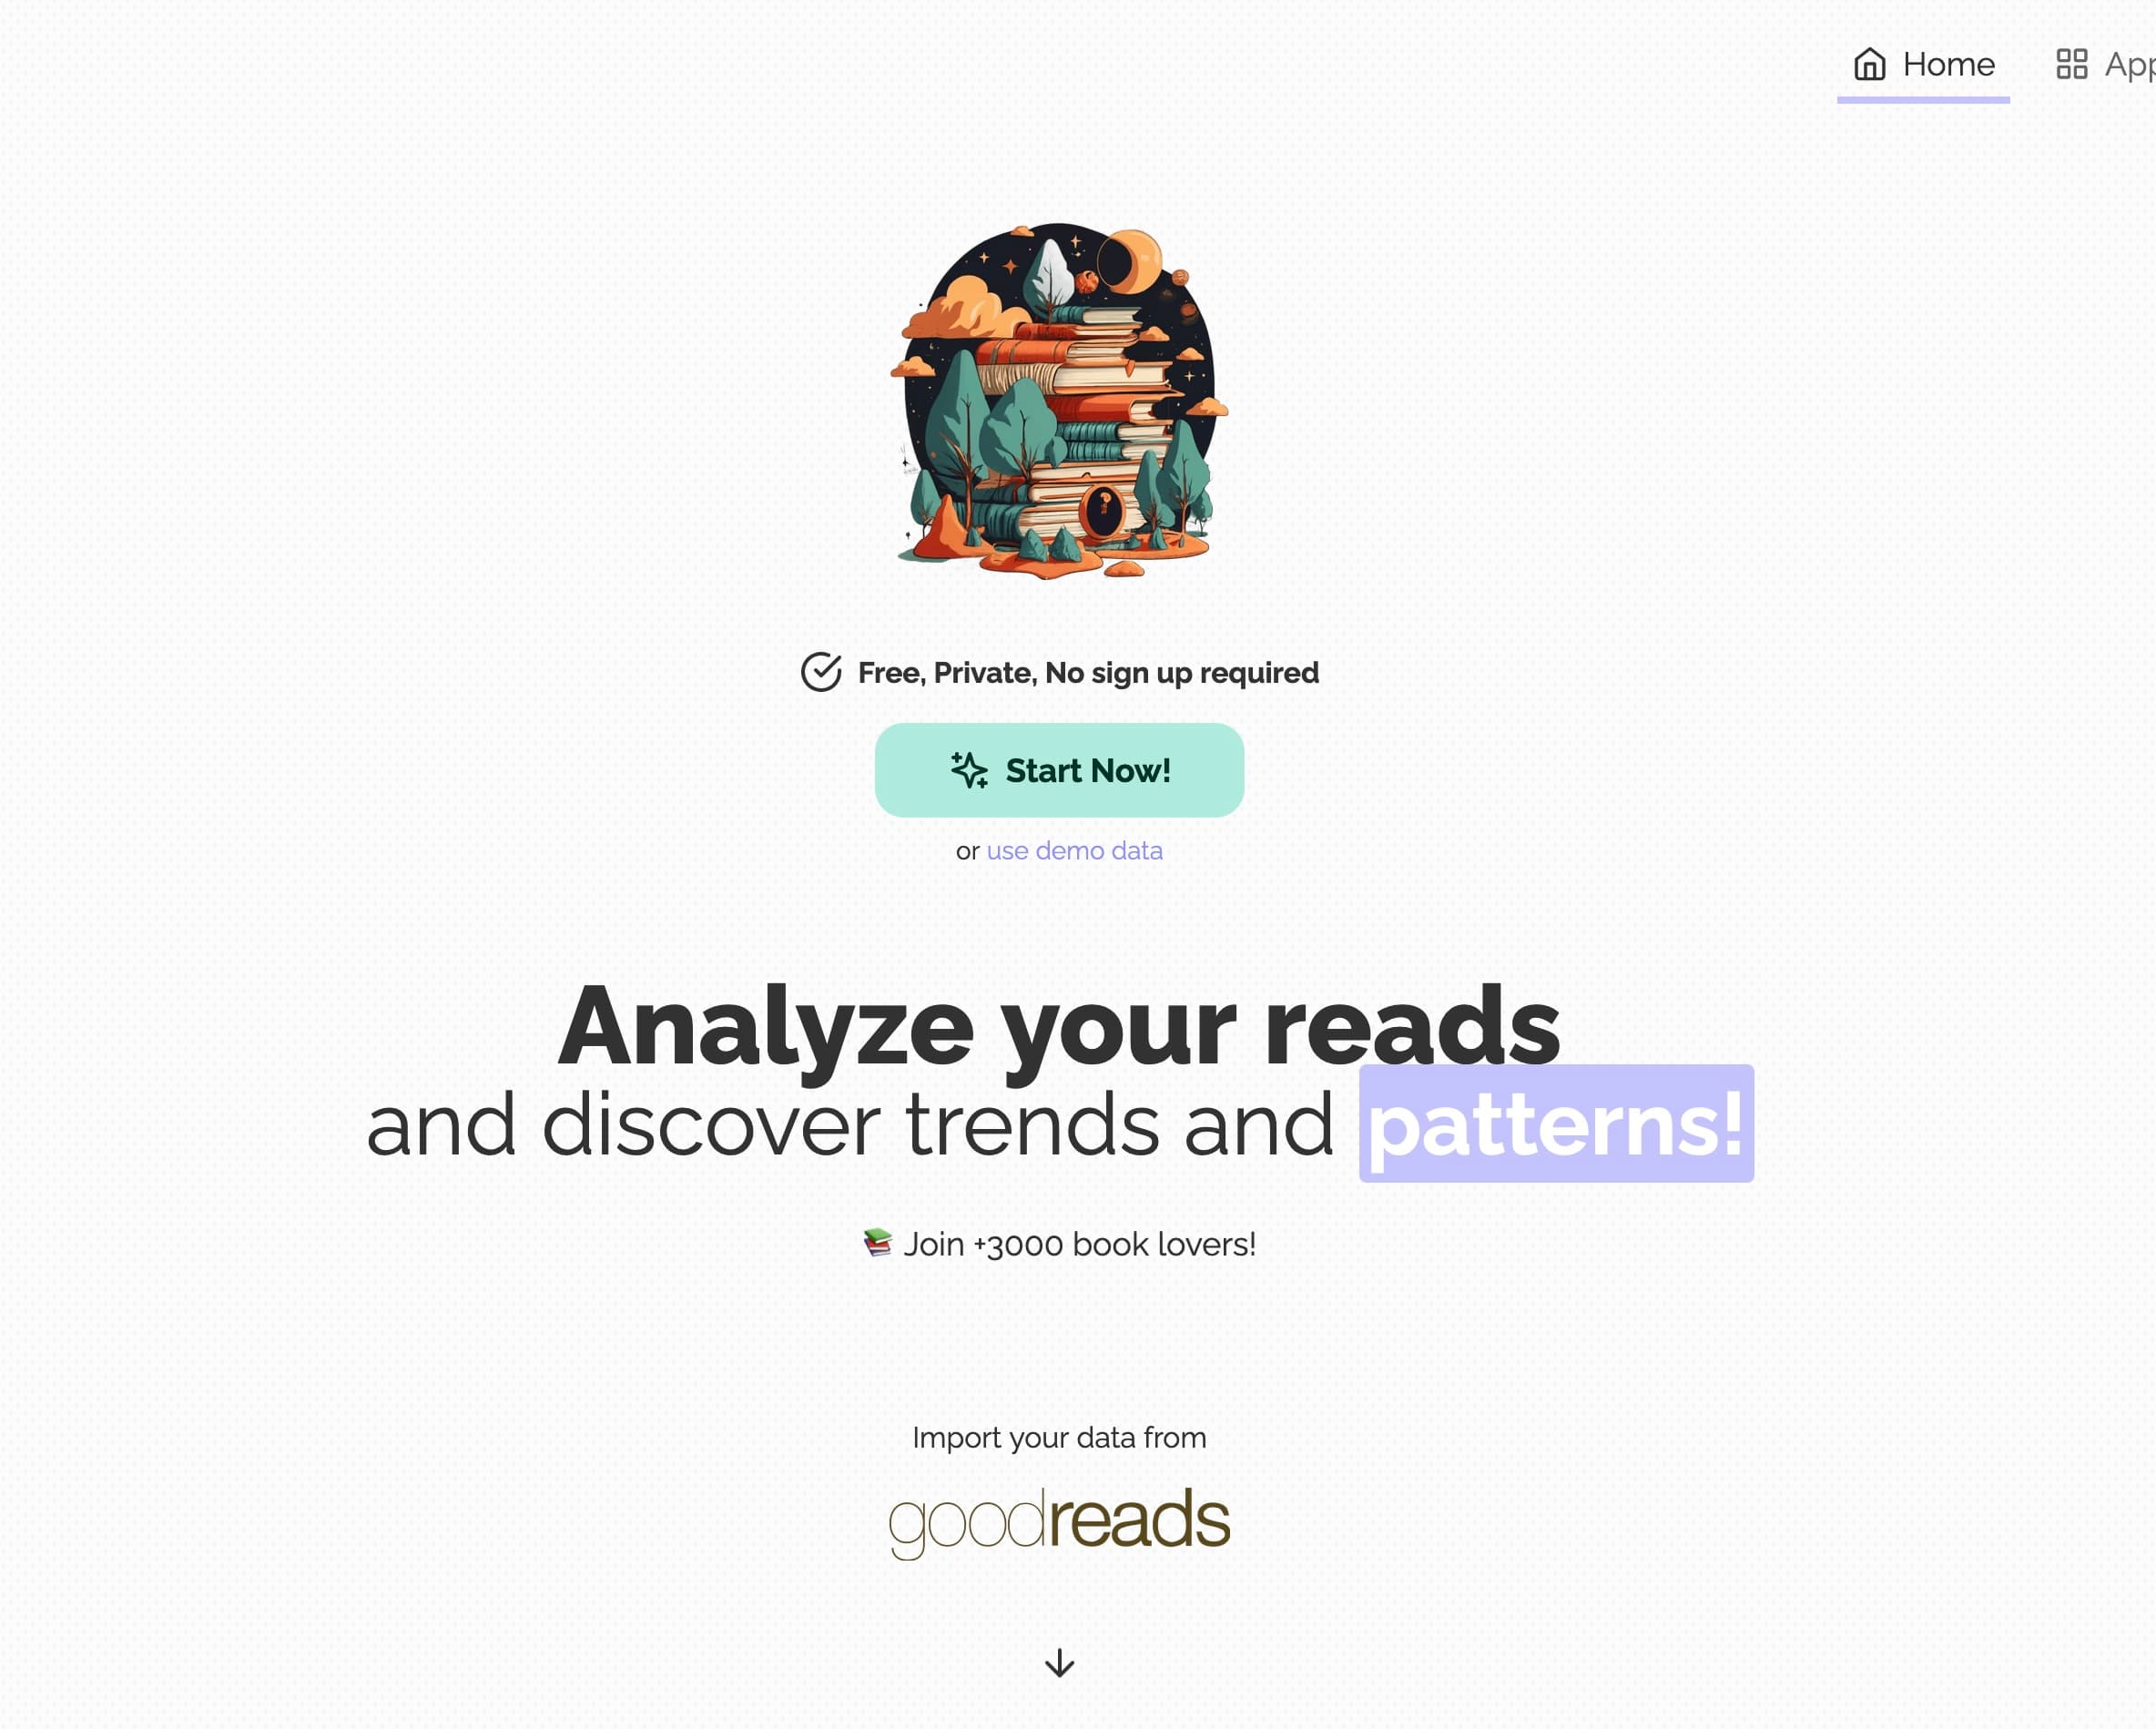
Readstats .
Spotify Wrapped for books.
Year 2023
Developed Solo
Side Project
Finished in 15 days
Data Analysis
Books
Side Project
Introduction
I'm a huge fan of reading and a data lover, which is how this project was born. Every year, I would strive to complete the Goodreads reading challenge. I love the simple metric of knowing how many books I've read in a year. Later, I discovered Spotify Wrapped, where both the quality and quantity of data are much higher and presented in an easily understandable way. It was then that I realized Goodreads was missing a key feature.
Problem
There aren't many popular options for reading tracking tools, with the most famous one being Goodreads. The tool is great and simple to use, but it lacks a lot in terms of data visualization and analysis. As a data analysis and stock market enthusiast, I love charts, or rather, good charts. The ones that make everything easy for everyone to understand. There was clearly a market need that I was eager to satisfy. I wanted to create an easy way to visualize your reading data.
Approach
The easiest way to approach this problem was by leveraging already existing data and platforms, so I used the existing Goodreads data. This way, Goodreads users were almost ready to use my solution, and I wouldn't need to search for hundreds of thousands of book properties.
The biggest challenges during this project were the lack of an API from Goodreads, leading me to use the CSV exports you can generate on the platform, a poor choice of a dataframe library in JS, and the huge amount of edge cases based on each user's reading history.
The first issue wasn't a technical one, but a user experience issue. The original plan was to make it as seamless as possible, but I had to adapt. The second issue was bypassed by creating my own wrappers for some library methods, solving the majority of the issues. The last caveat was gradually solved by implementing effective user feedback mechanisms, which allowed me to notice and fix these edge cases.
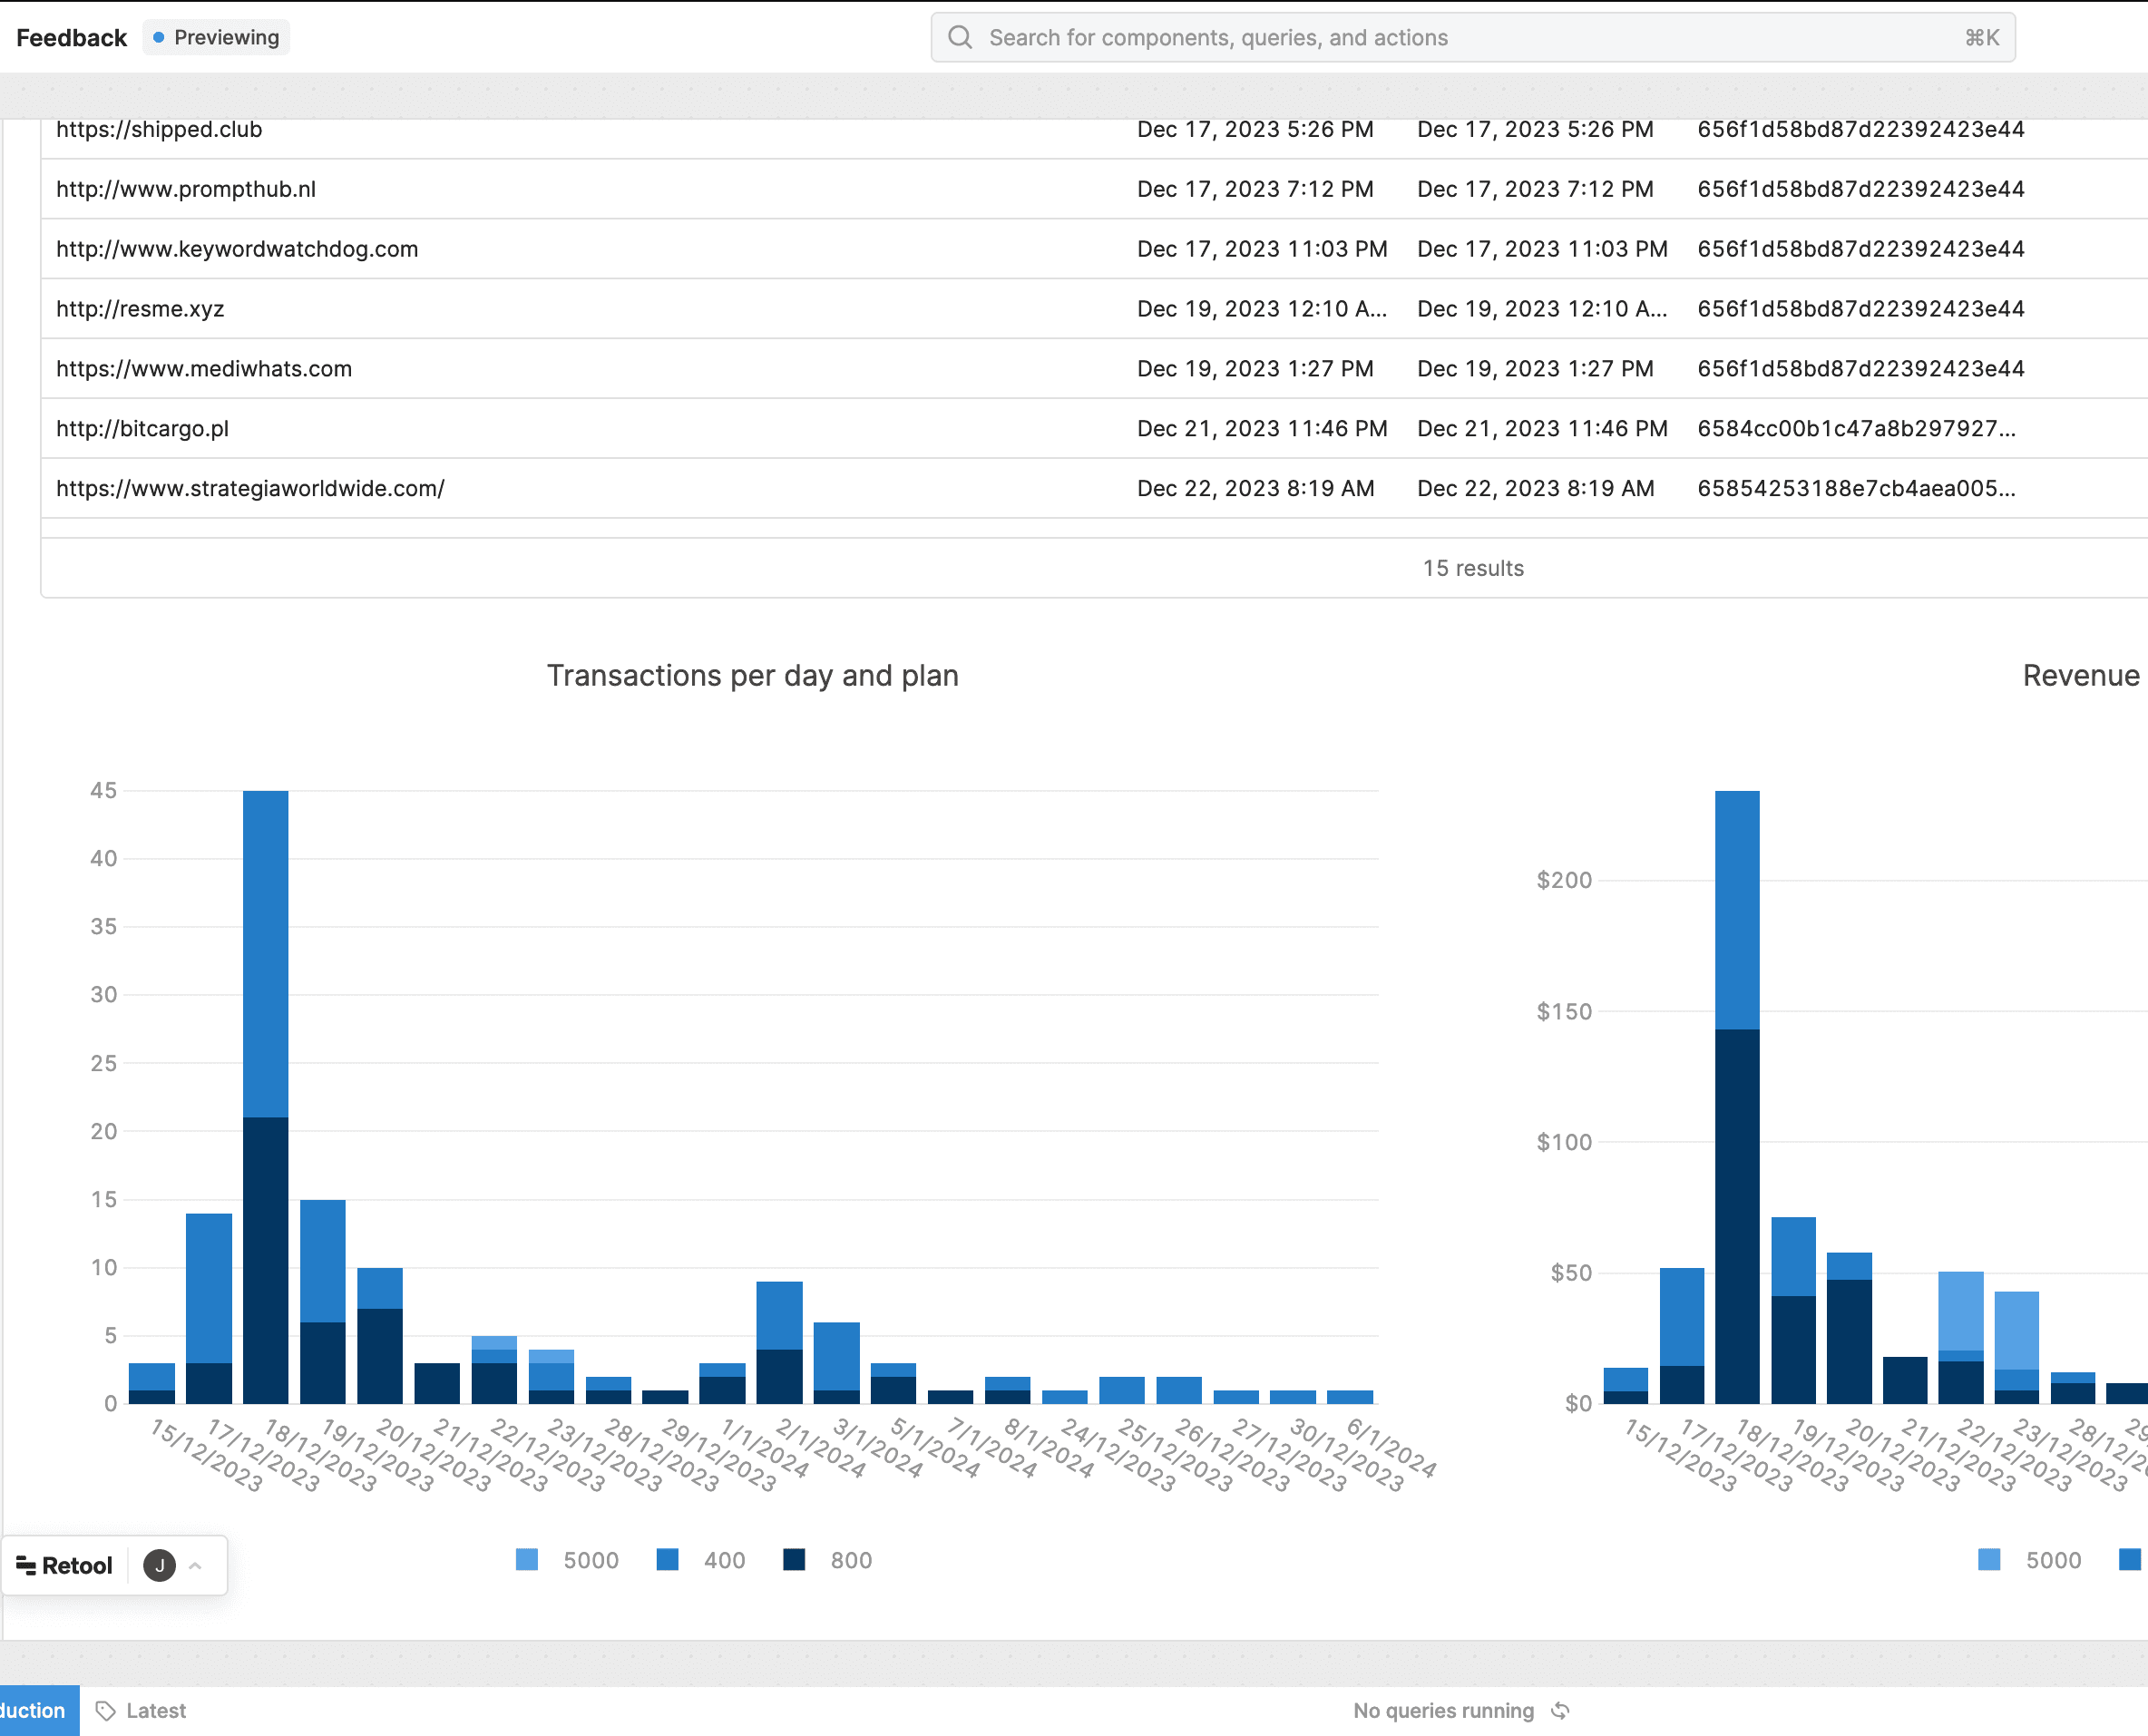
Results
The results were very good as the general public loved the idea and the execution. People still use the tool today without giving me extra work, and thanks to the feedback mechanisms, I know when something breaks without having to check it every day.
More projects
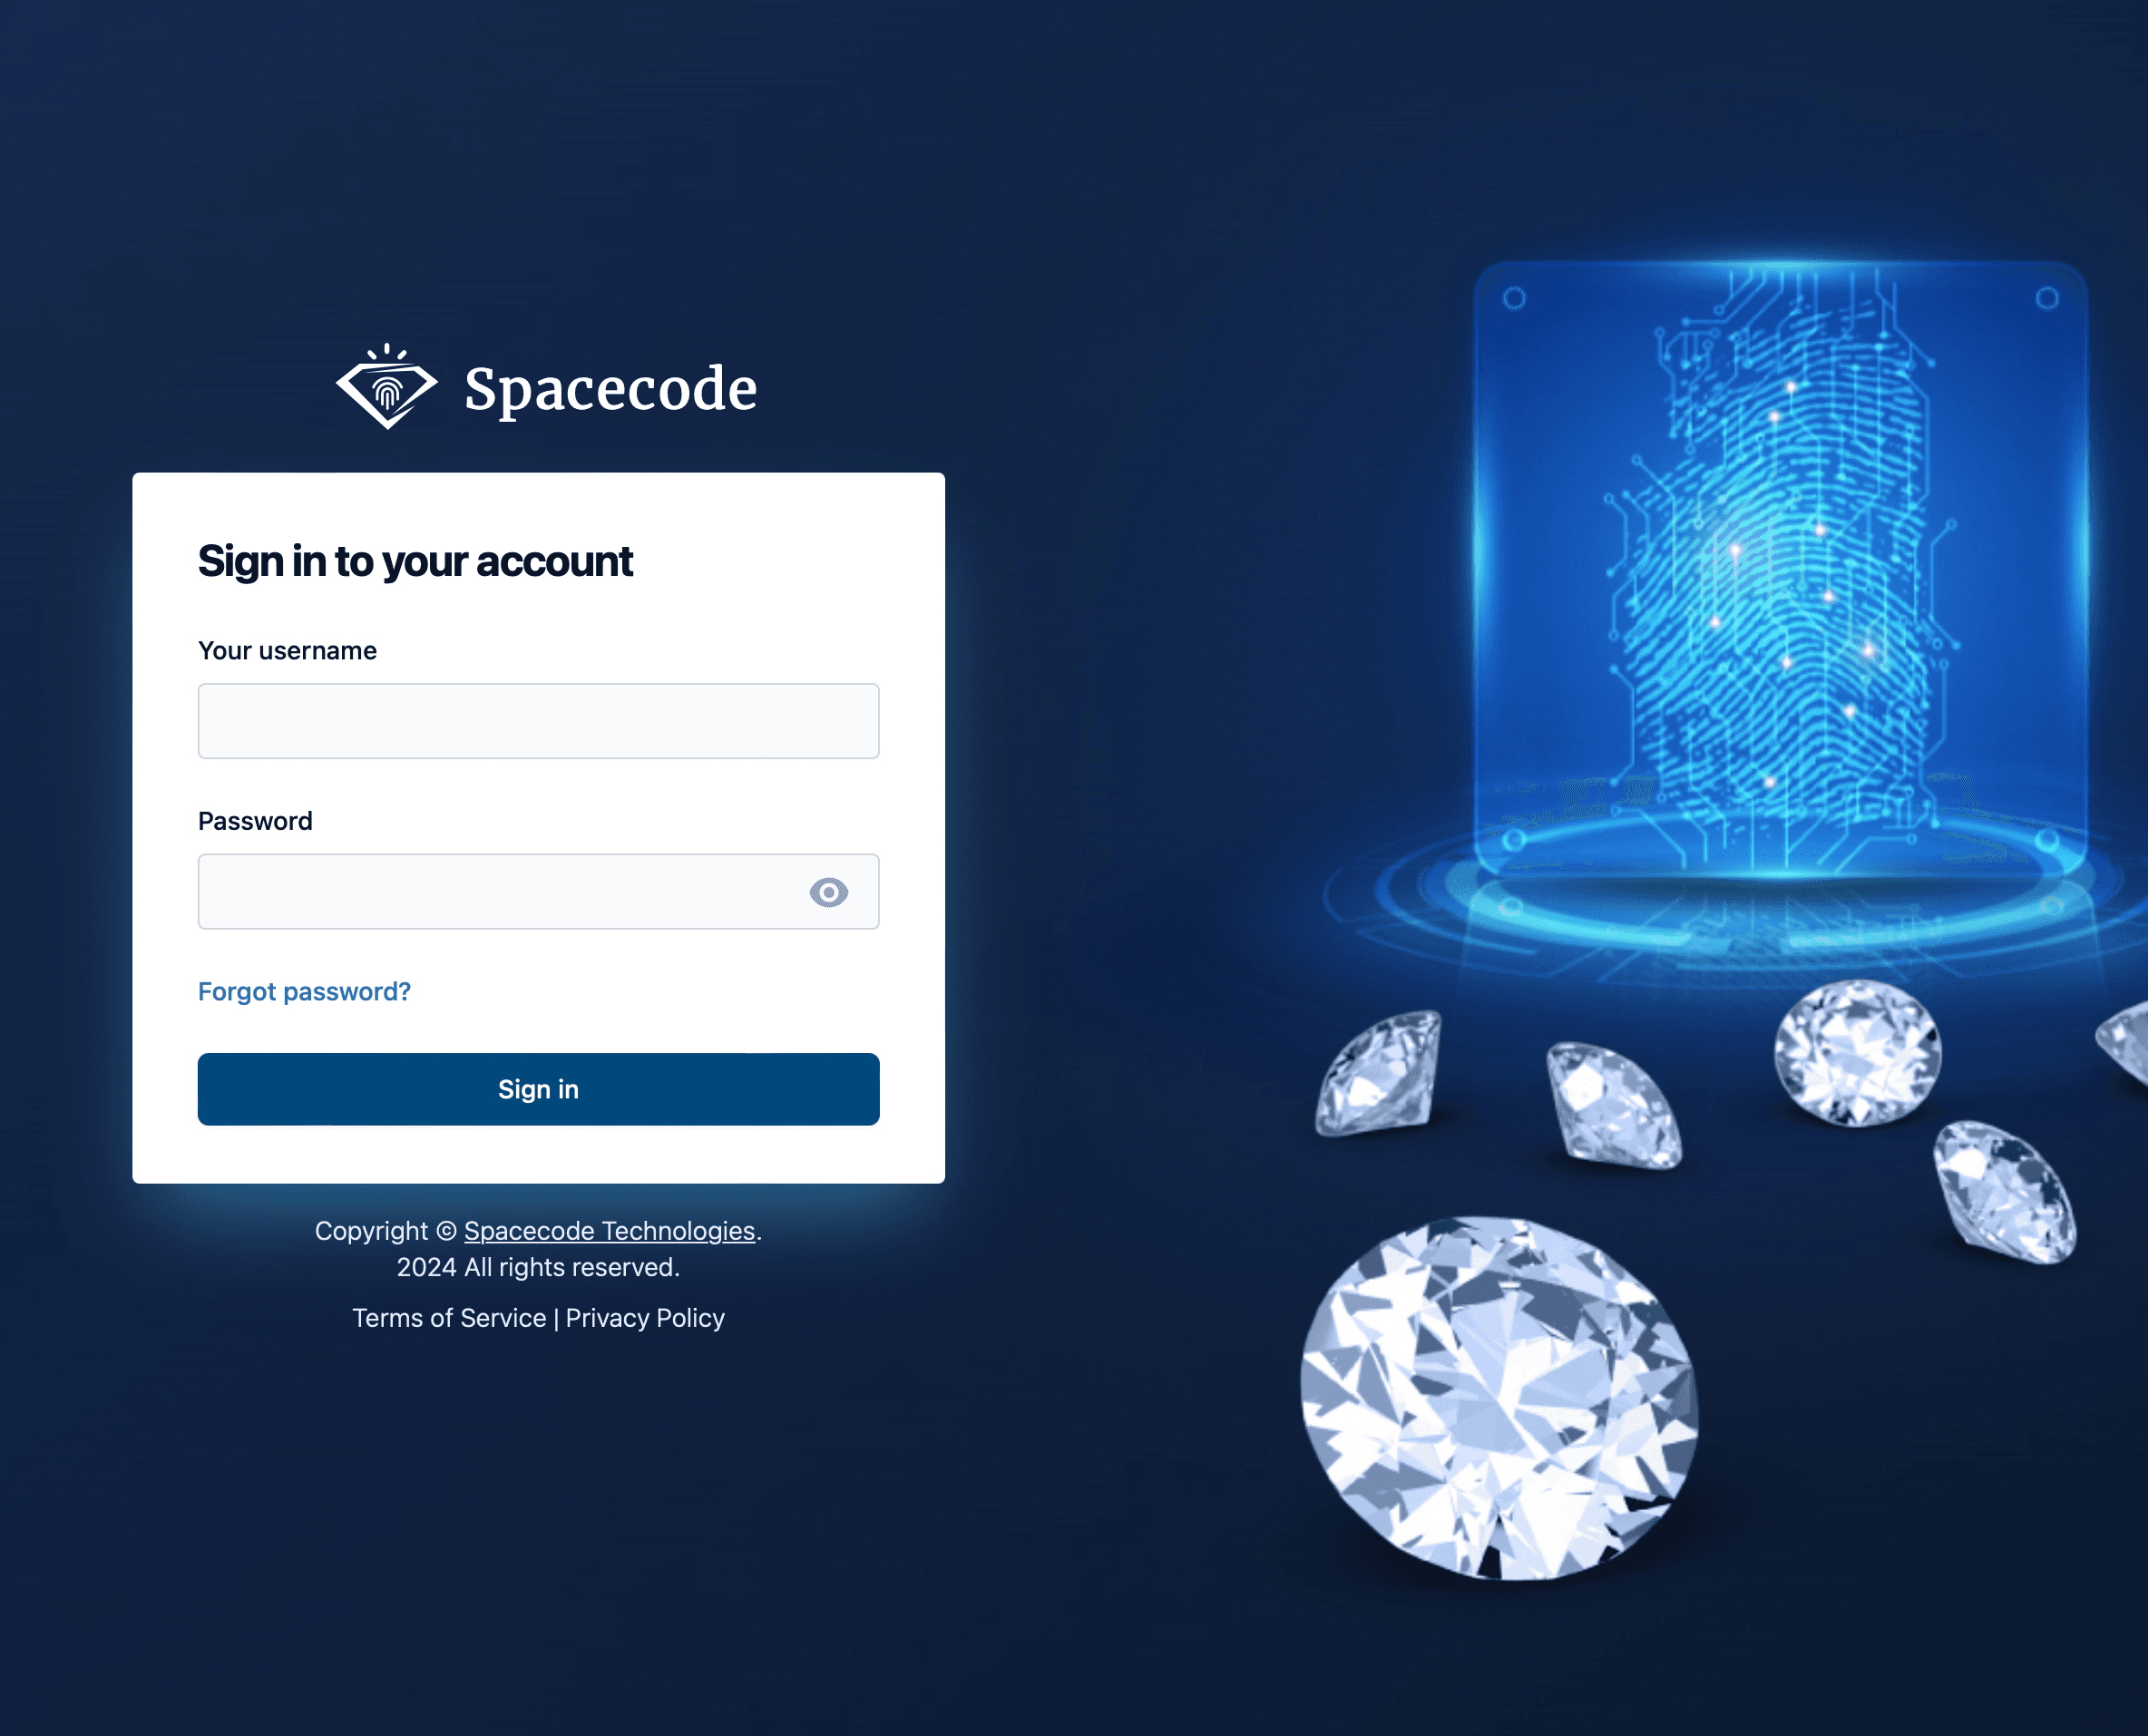
Diamond Match
Manage and identify diamonds.
Diamond Match
Manage and identify diamonds.
Data Analysis
Computer Vision
Inv. Management